Marketing Analytics Case Study
GA4 Ecommerce
Growth Audit
Optimizing acquisition quality, product visibility, and the purchase journey
I analyzed the Google Analytics 4 Demo Account for the Google Merchandise Store to understand acquisition quality, product performance, and purchase-journey friction.
Analysis period: March 24–June 21, 2026
Demo account. I didn't implement anything. Treat the numbers as a way to pick a first test, not a client result.
A concise, decision-oriented readout for a marketing manager: what created valuable activity, where the funnel leaked, and which experiments should be tested next.
Executive summary
The biggest traffic source was not the best quality source.
I found a familiar ecommerce pattern: the biggest traffic source was not the best quality source, and the biggest conversion opportunity sat in the mobile purchase journey. Organic Search combined meaningful scale with the strongest engagement, while mobile users experienced steep drop-off from product view to purchase.
I recommend improving attribution, making high-converting products easier to discover, and removing mobile friction with a focused experiment sequence rather than chasing more volume first.
Case-study introduction
What I analyzed and why.
01 / Insight
Direct traffic created volume but relatively weak engagement.
Direct accounted for 209,231 sessions, or 65.27% of all traffic, but its engagement rate was only 23.46%. Organic Search generated 59,575 sessions with a much stronger 67.73% engagement rate.
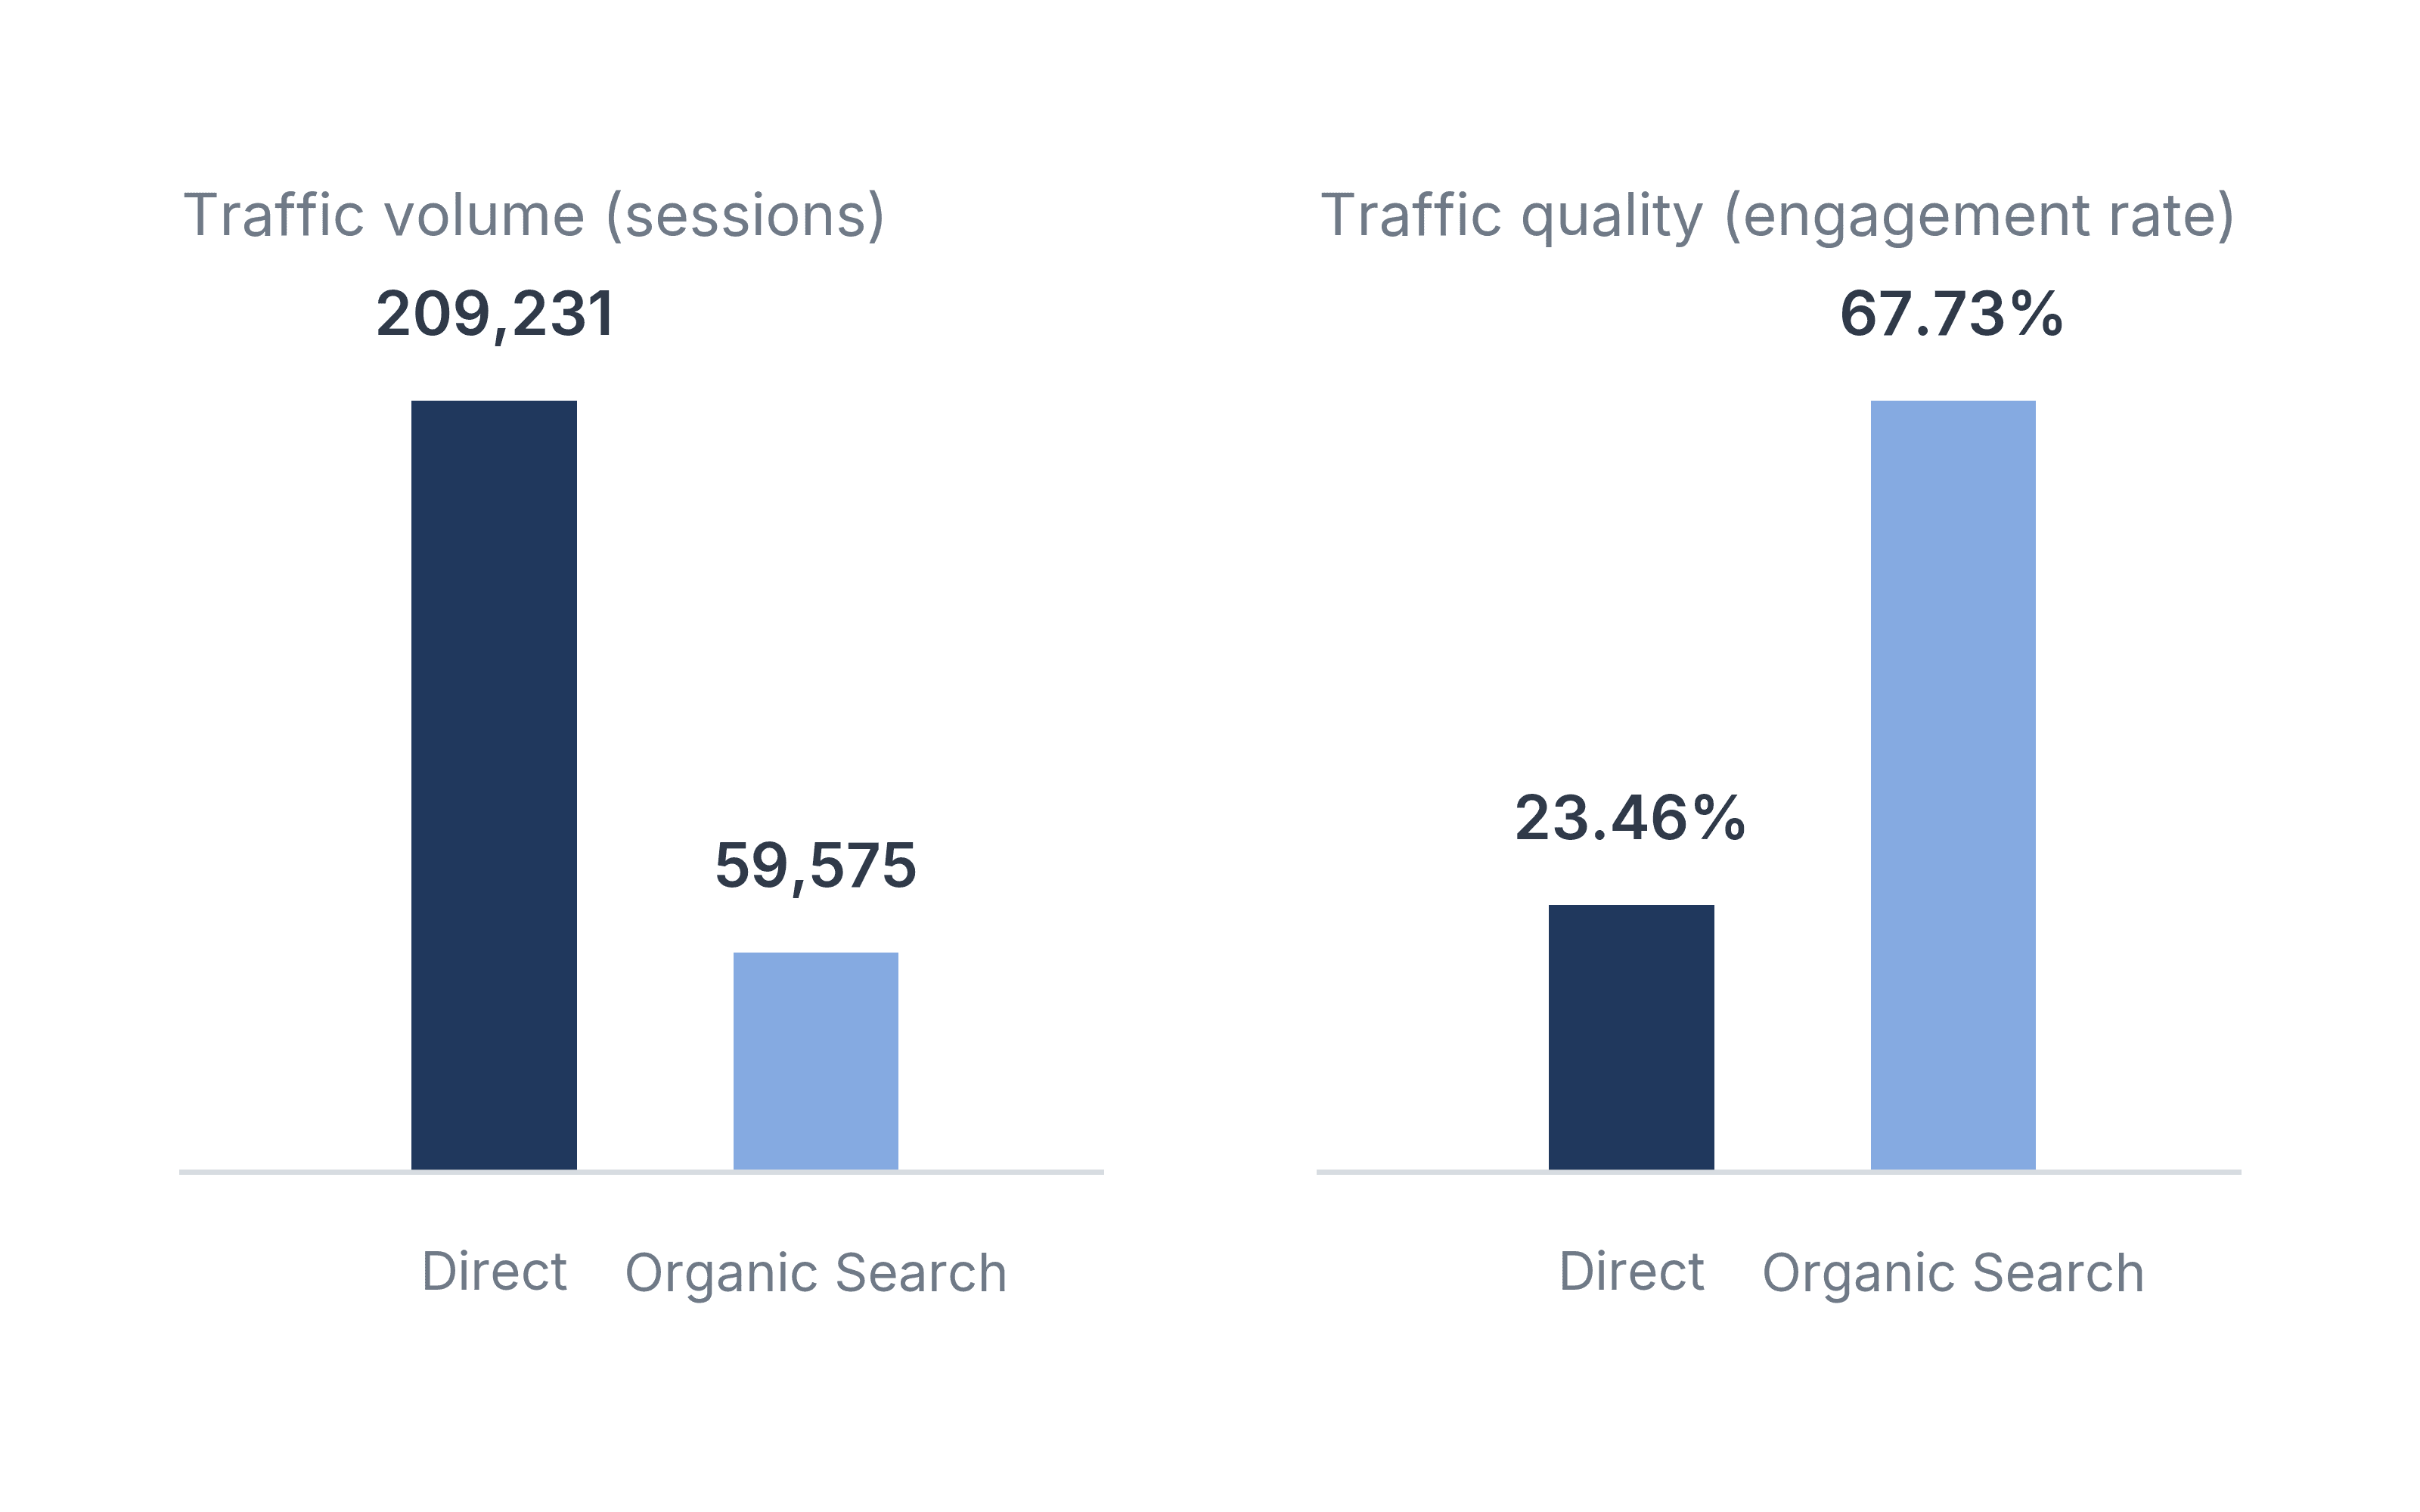
Direct created traffic volume, but Organic Search delivered a healthier balance of scale and engagement. The unusually high Direct and Unassigned shares also make attribution hygiene a business issue, not just a reporting issue.
02 / Insight
Organic Search provided the strongest balance of scale and traffic quality.
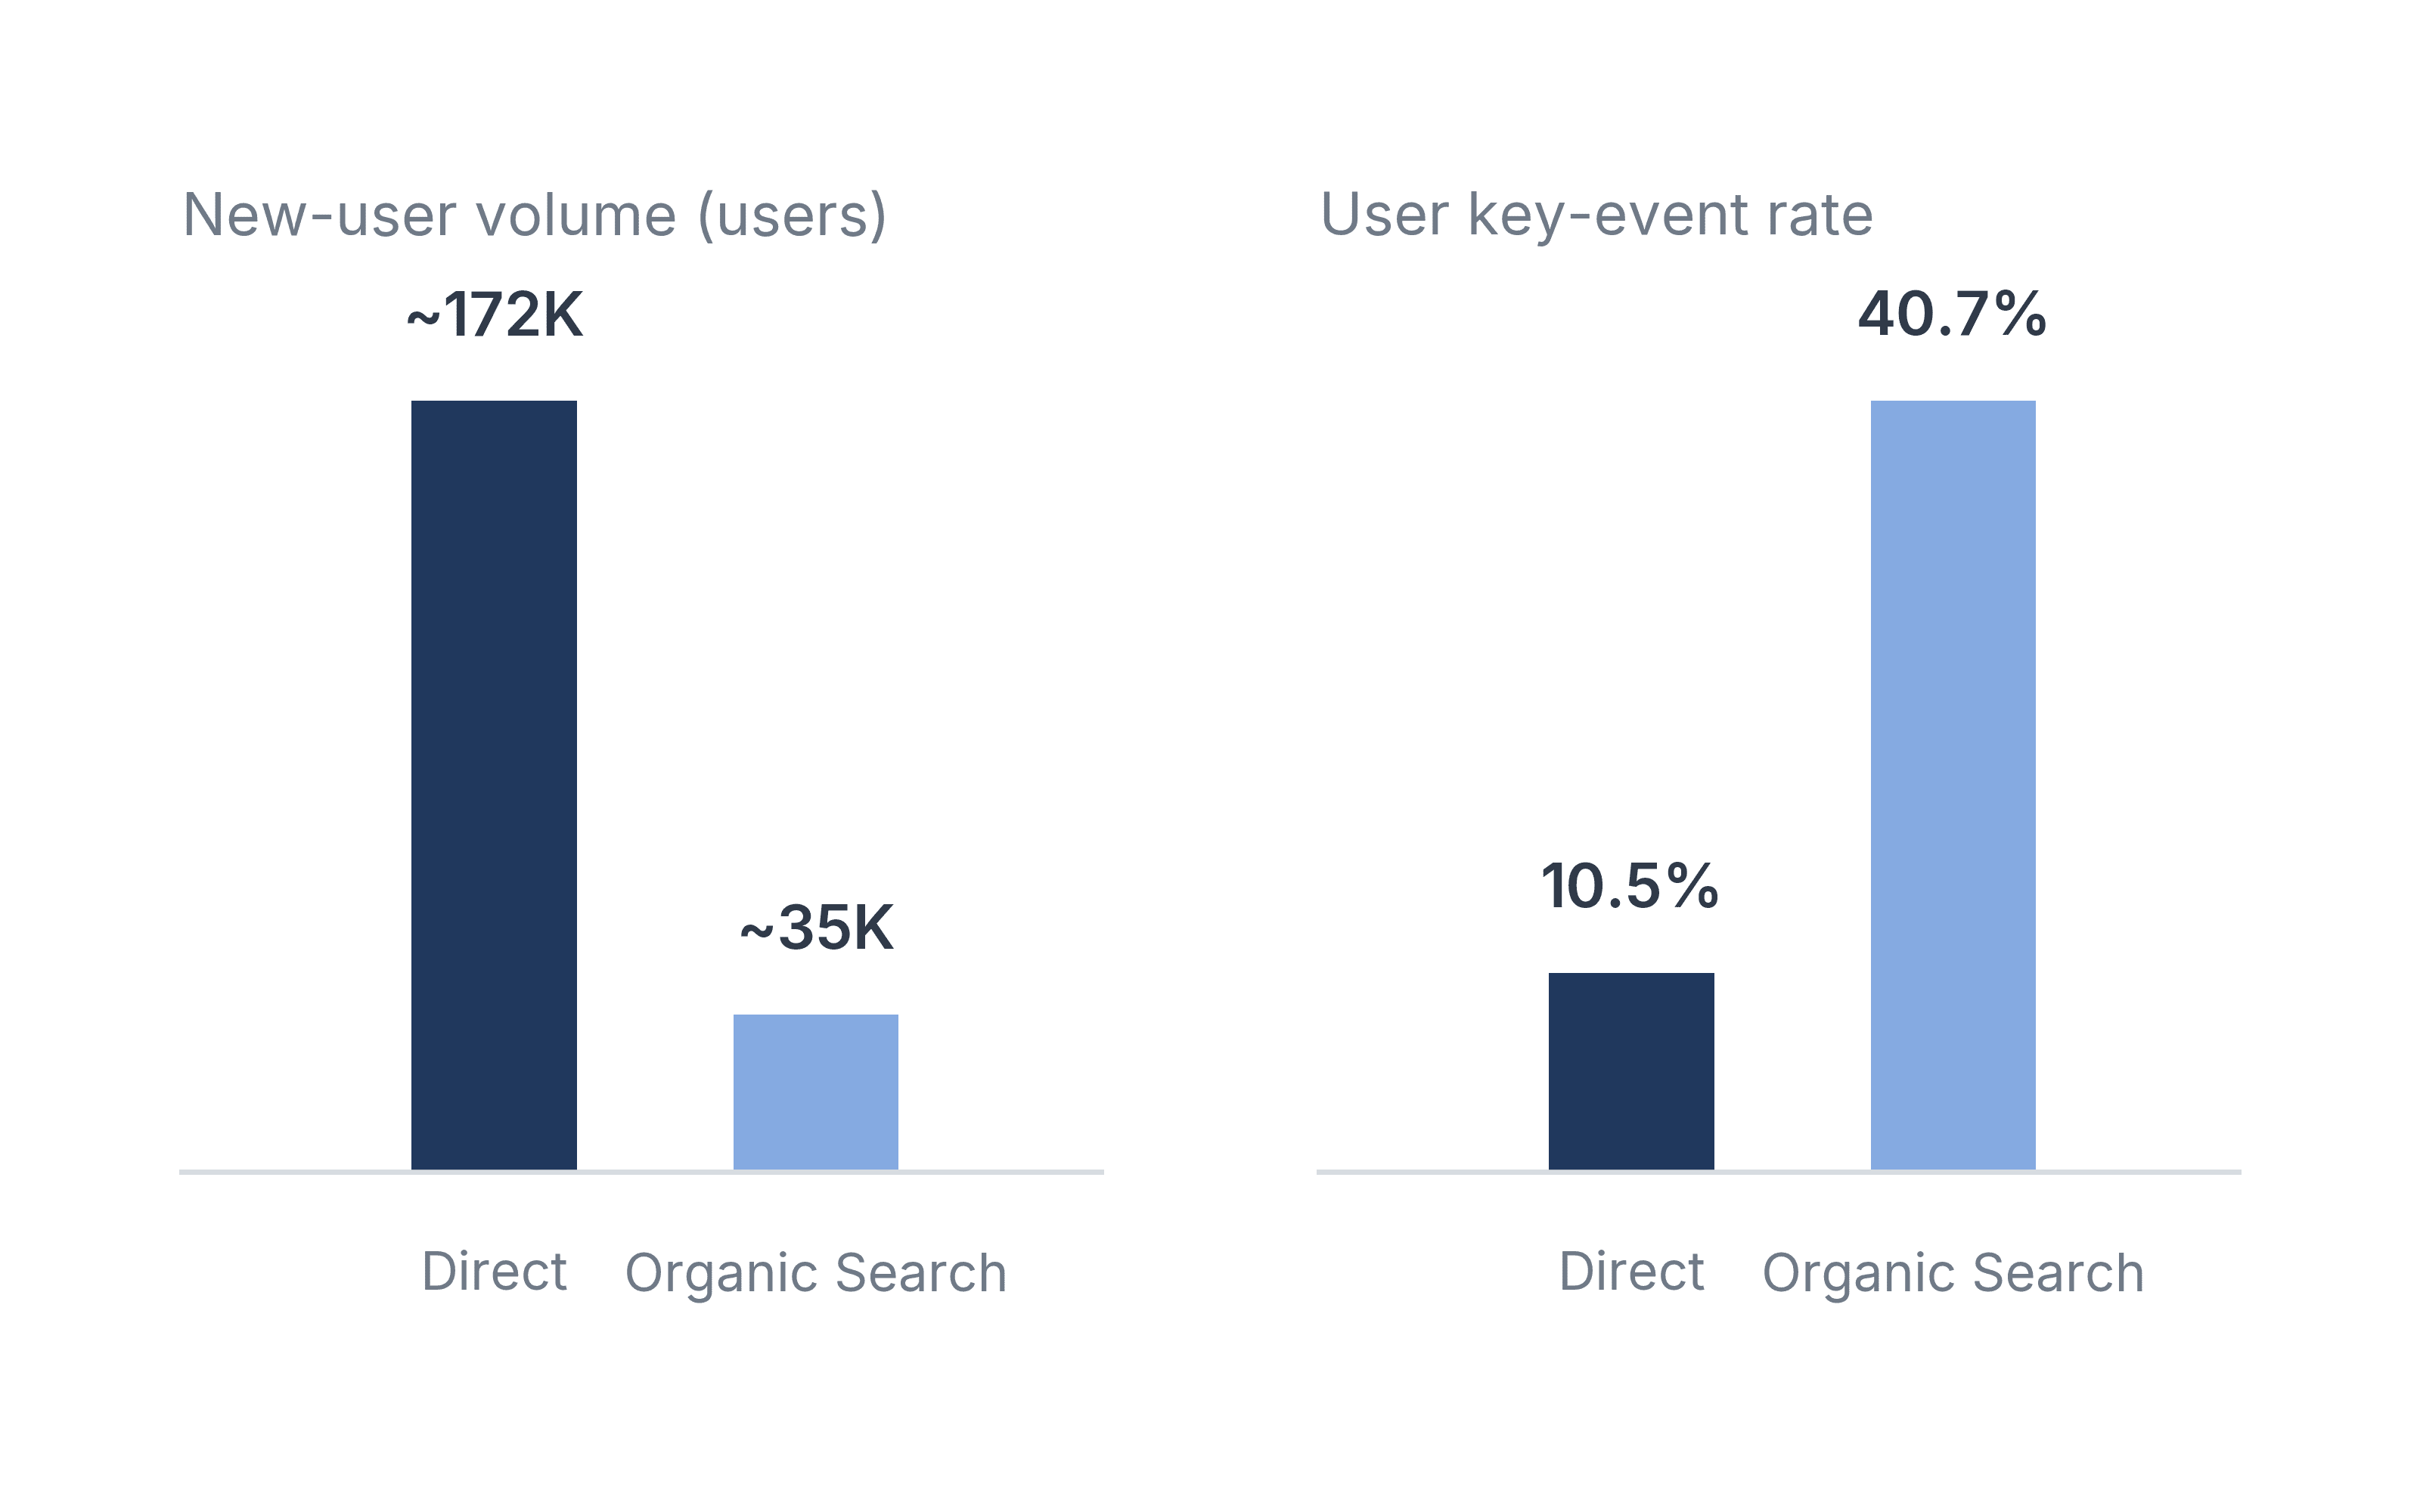
First-user acquisition reinforced the same pattern: Direct brought roughly three-quarters of new users, but its user key-event rate was about 10.5%. Organic Search brought about 35K new users and achieved an estimated 40.7% key-event rate.
User key-event rate represents the percentage of users who triggered at least one designated key event.
03 / Insight
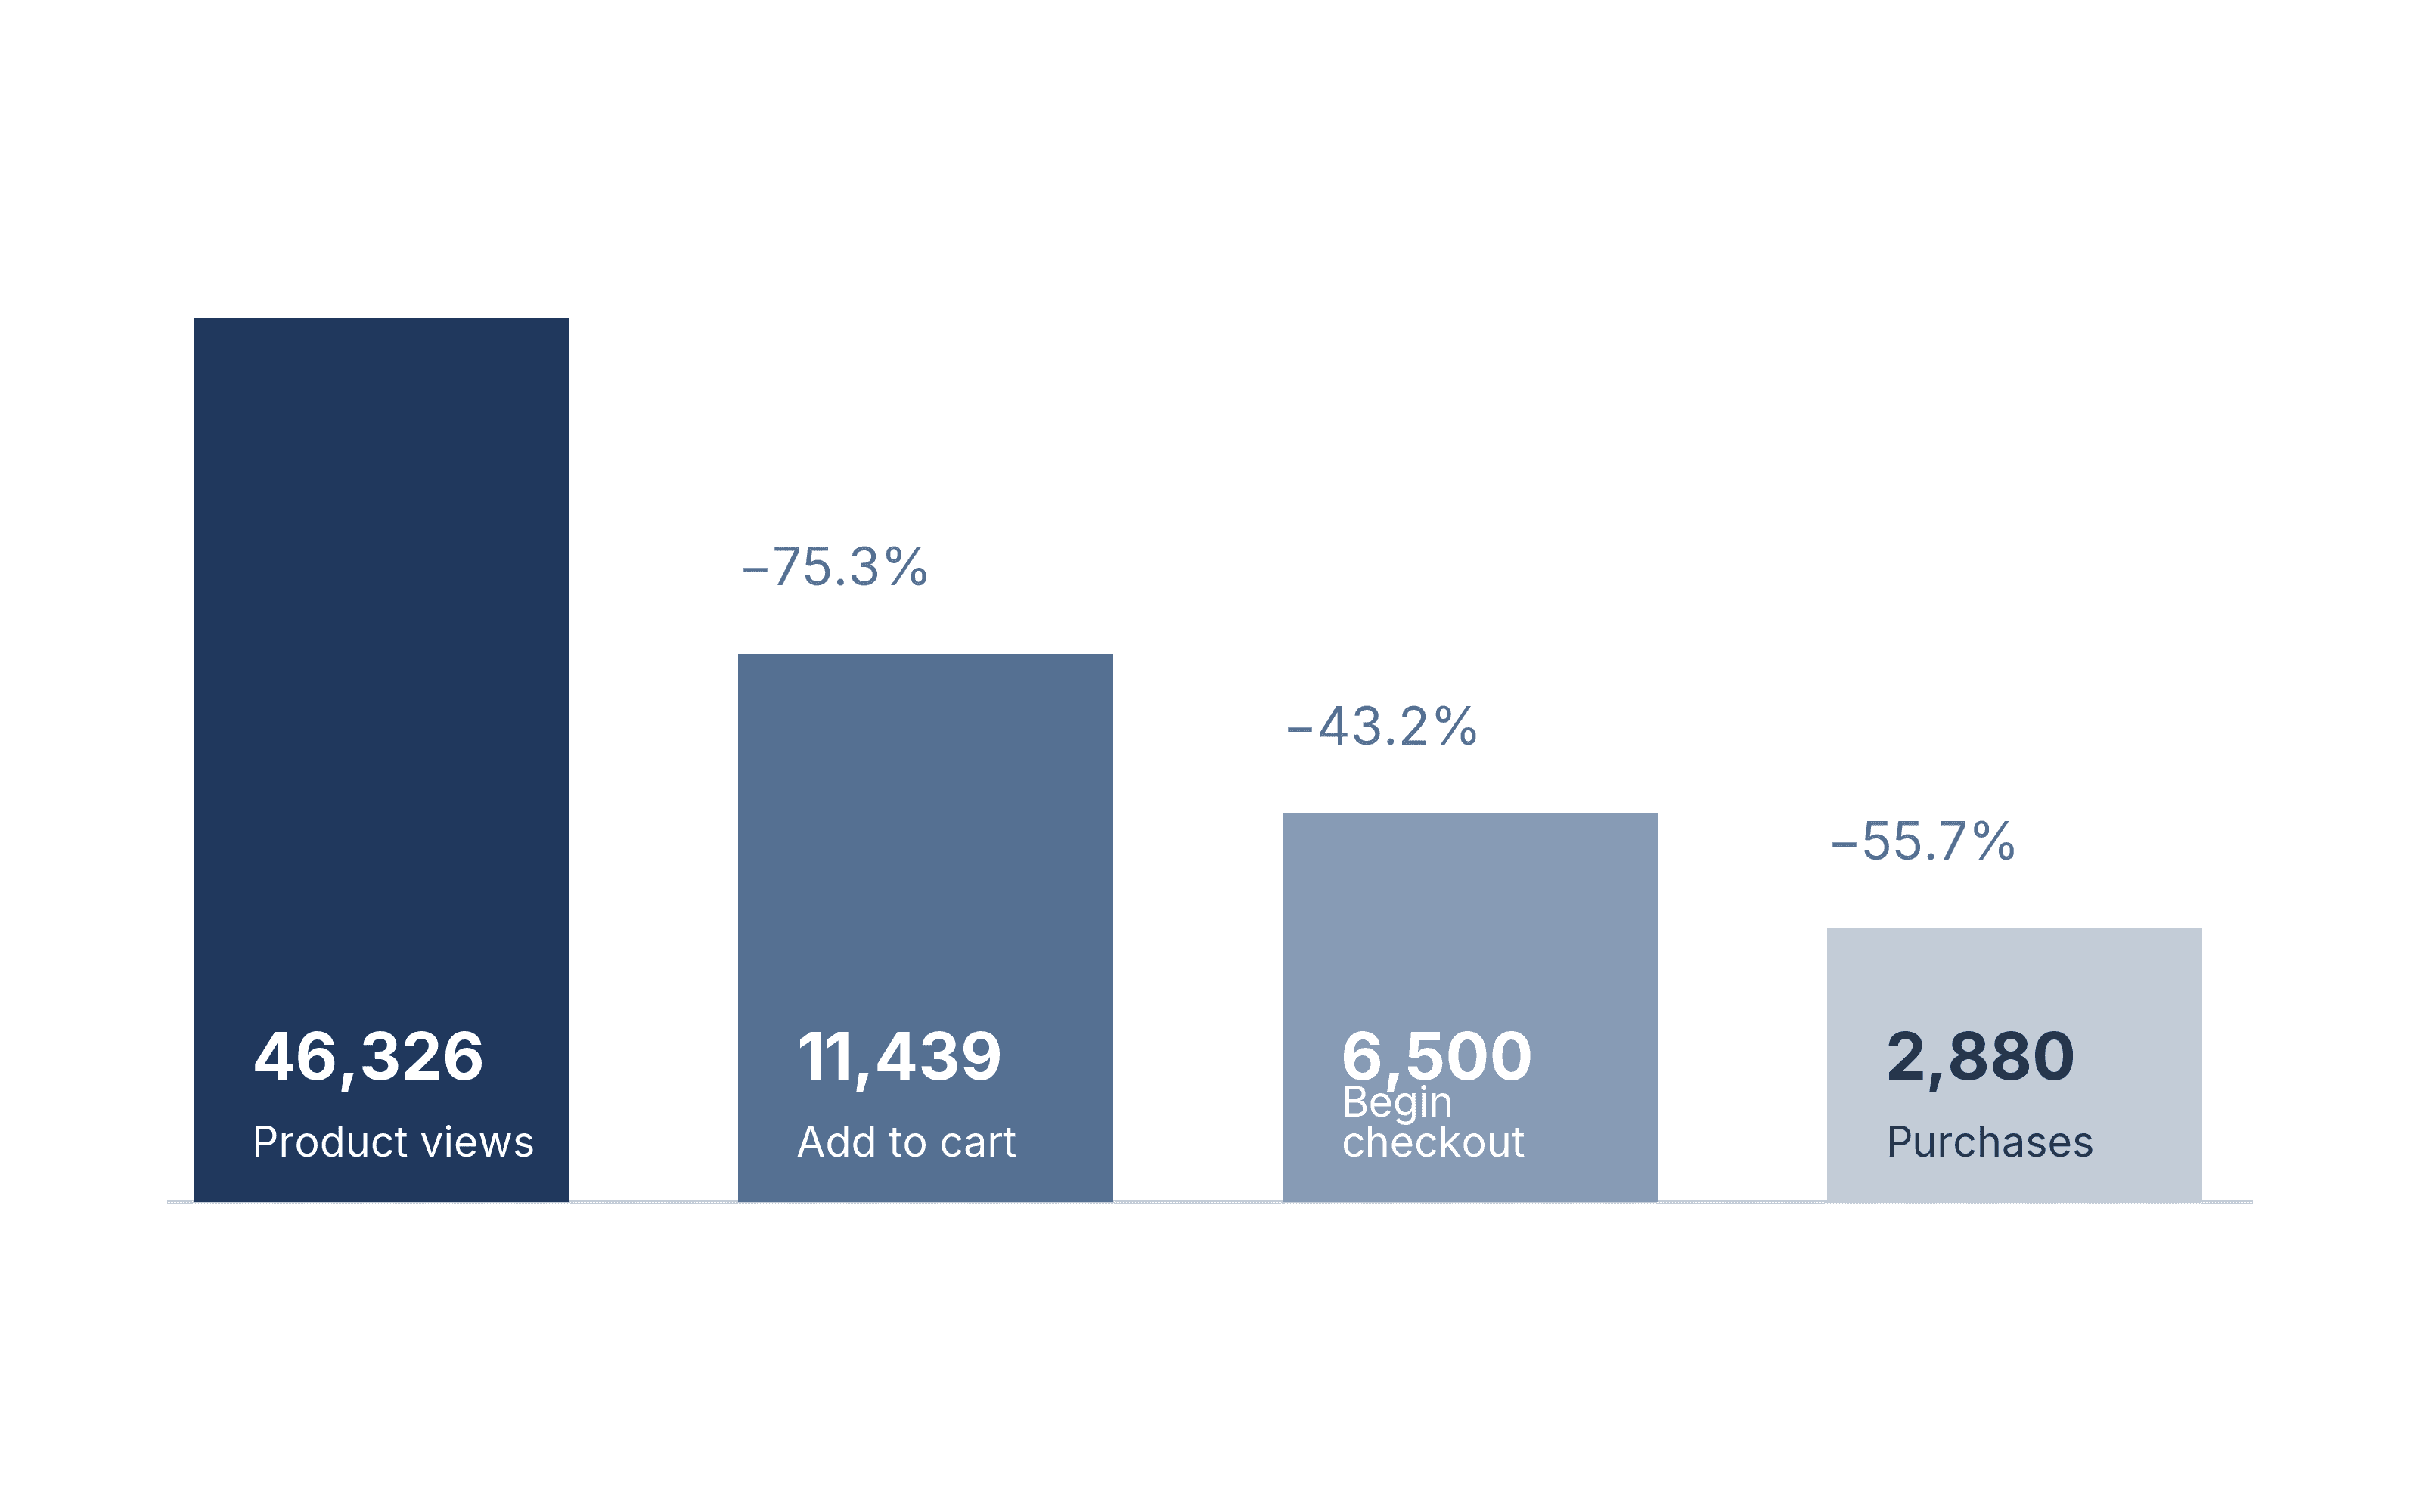
The purchase journey loses most users before cart and checkout.
Of 46,326 users who viewed a product, only 11,439 added one to the cart—a 75.31% drop-off at the first major transition. The full funnel ended with 2,880 purchasers, producing a 6.22% view-to-purchase completion rate.
03 / Device Insight
Mobile customers experience the largest conversion gap.
Desktop checkout completion: 55.25%
Mobile checkout completion: 24.14%
Product visibility did not always translate into revenue: the Nano Banana Sweatshirt had the most displayed product views at 6,139, while the Google Recycled Black Hoodie generated the highest displayed revenue at $19,935. The Google Eco Tee White achieved the highest displayed purchase rate at 14.65%.
04 / Executive Dashboard
A manager-ready snapshot.
This is the one-minute readout: the channel opportunity is quality, the device opportunity is mobile conversion, and the next step is focused experimentation.
Channel engagement rate
Device view-to-purchase completion
Protect the acquisition engine, but allocate the next optimization cycle to mobile conversion and product discovery. The largest upside is likely to come from reducing friction, not simply buying more traffic.
05 / Experiment Roadmap
Three experiments to turn insight into action.
The findings translate into three focused tests that a marketing, UX, and analytics team could launch and measure.
06 / Prioritized Recommendations
Sequence the work by impact and effort.
The sequence starts with the clearest conversion weakness, then moves to changes most likely to reduce decision friction and increase merchandising leverage. Attribution hygiene remains important, but it should not delay higher-impact UX tests.
| Priority | Recommendation | Why now |
|---|---|---|
| 01 | Mobile CTA + checkout | Largest observed performance gap |
| 02 | Shipping transparency | Reduces late-stage uncertainty |
| 03 | Product visibility | Turns proven demand into more exposure |
| 04 | Attribution hygiene | Improves confidence in channel decisions |
07 / Limitations
What this analysis can and cannot claim.
The data was historical or sample ecommerce data. Customer-level qualitative research was not available. Recommended experiments were not implemented. Expected improvements are targets, not achieved results.
These findings are prioritization signals rather than proof of causation. Instrumentation, event definitions, and test baselines should be validated before launch.
Closing point
The strongest opportunity is not simply more traffic. It is a more intentional path from discovery to product confidence to checkout—especially on mobile.